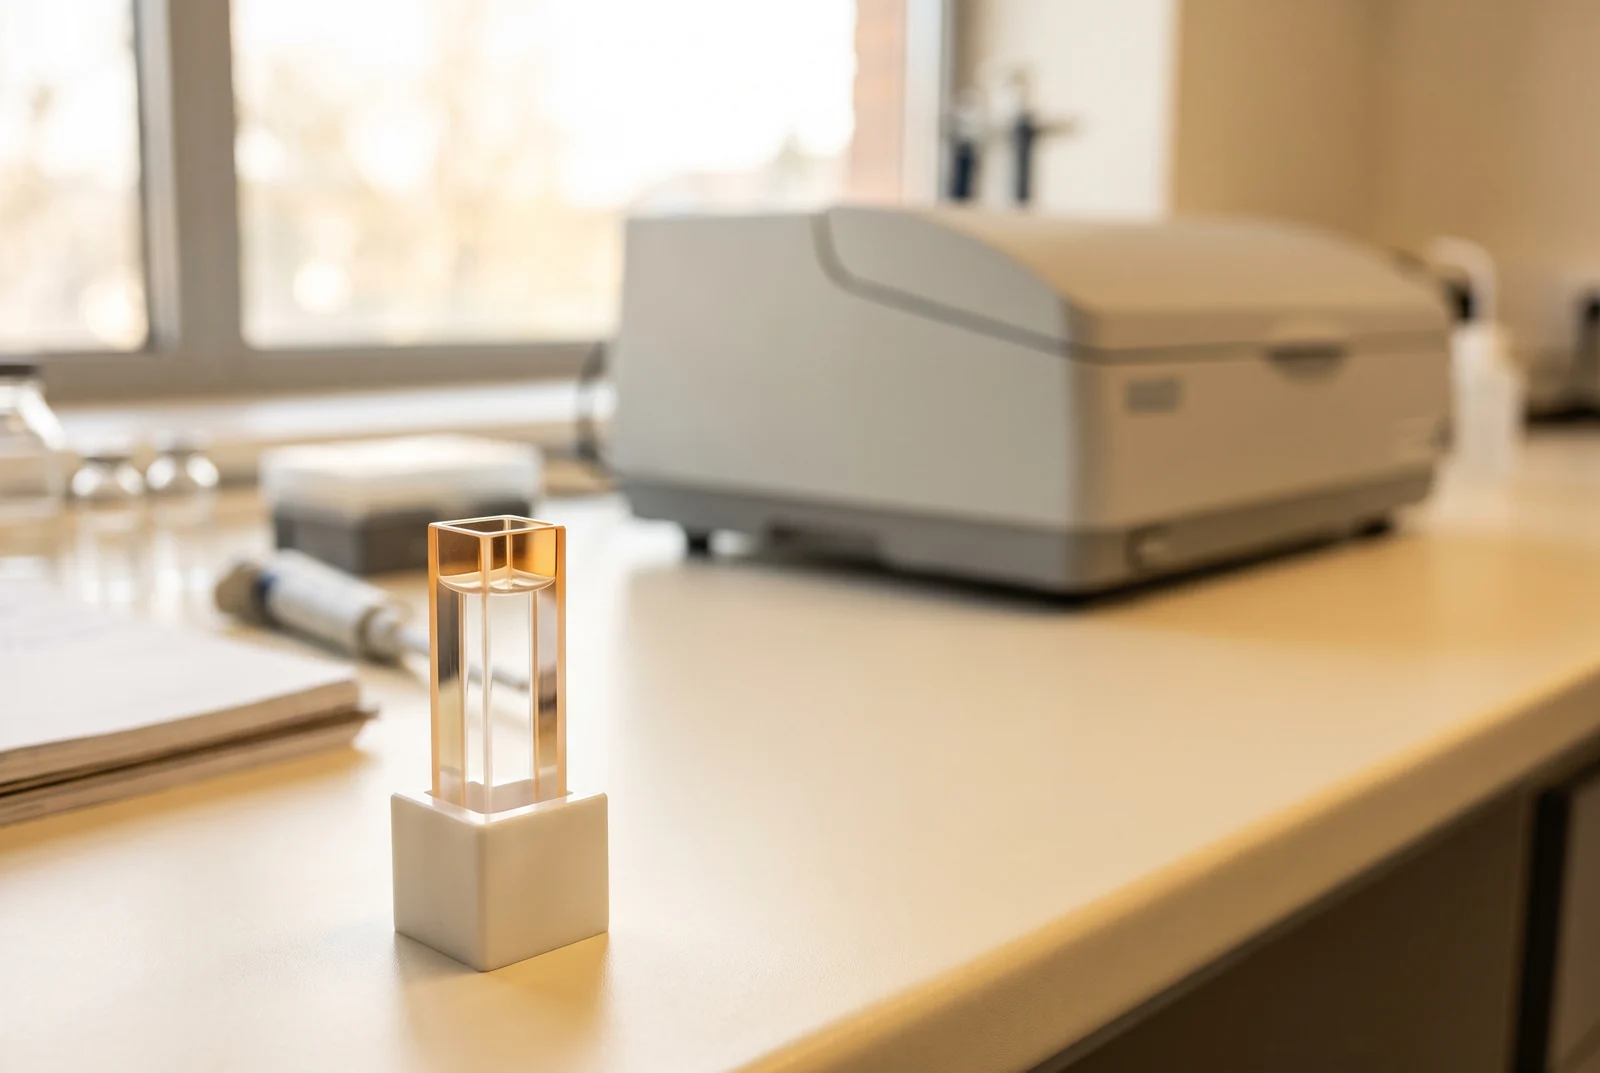
Circular dichroism, or CD, measures how differently a sample absorbs two forms of circularly polarized light. For peptides, the resulting curve can reveal patterns consistent with helical or sheet structure, as well as more disordered conformations. Comparing that curve with suitable reference data helps estimate secondary structure, but it does not locate every atom or identify the amino acid sequence.[4][6]
Buy 1, Get 1 20% Off
Pick any two research compounds. Take 20% off the lower priced one.
Applied automatically at checkout, no code needed
Claim my 20% off →In every pair, the lower priced item is 20% off after other discounts; accessories excluded. For research use only.
This explainer covers the interpretation of structural measurements. IQON Labs reader offers are separate from the studies discussed here.
Why molecular shape changes the light signal
Circularly polarized light has an electric field that rotates as the light travels. The two forms rotate in opposite directions. A molecule in an asymmetric environment can absorb these forms differently, producing the small difference measured by CD. A spectrum shows how that difference changes with wavelength.[4]
In the far ultraviolet region, the peptide backbone makes a major contribution to the signal. The groups joining amino acids absorb light, and their arrangement affects how those absorptions interact. When the backbone forms a helix or a sheet, those groups adopt different relative orientations, changing the shape of the spectrum.[4][6]
This gives a physical basis for comparing curves. The familiar spectral patterns reflect molecular geometry, rather than arbitrary labels attached to a graph. Turning a measured curve into a quantitative structural estimate still requires an appropriate model and examples whose structures are already known.[4][6]
What a helix or sheet looks like in a spectrum
An alpha helix is a coiled arrangement of the backbone. A beta sheet contains extended strands arranged alongside one another. Both are forms of secondary structure, the recurring local arrangements within a peptide or protein, rather than a complete description of its three dimensional shape.[4][5]
Helical spectra commonly have two negative bands near 208 and 222 nanometers. A familiar antiparallel beta sheet pattern has a negative band near 218 nanometers. These are useful reference features, not universal identification rules: the overall curve contains contributions from all the structural elements present.[4][6]
Beta sheets are especially varied. Neighboring strands can run in the same or opposite directions, and the sheet can twist by different amounts. Those differences can change the positions and signs of spectral features enough to make two samples with similar overall sheet content look surprisingly different.[5]
Why a fitted percentage is an estimate
Quantitative analysis compares the measured spectrum with reference spectra or derived structural components. Software seeks a combination that reproduces the observed curve and reports the corresponding fractions of structural categories. This is an inference from a whole spectrum, rather than a direct count of helices under a microscope.[4][6]
The reference set matters because it defines the kinds of structures represented in that comparison. A collection dominated by folded, globular proteins may describe a flexible peptide poorly. Greenfield’s foundational review distinguishes protein based and polypeptide based references and explains why different sample classes can need different comparisons.[4]
The algorithm matters too. Categories can differ between methods, including how they assign distorted helix ends, turns or structures that fall outside the main classes. A percentage labeled “unordered” must therefore be interpreted using the method’s definition, rather than treated as a universal measurement of disorder.[5][6]
What BeStSel added to the picture
The 2015 PNAS paper by András Micsonai and colleagues addressed a specific weakness in CD interpretation: the diversity of beta sheet spectra. Their BeStSel method separates parallel and antiparallel sheets and distinguishes different degrees of twist within antiparallel sheets.[5]
That change let the method account for spectral differences that simpler descriptions could misassign. The paper shows examples of proteins with similar amounts of antiparallel sheet but markedly different spectra, illustrating why a single standard sheet curve can be inadequate.[5]
BeStSel also uses the resulting structural composition to suggest possible protein folds from known structures. The authors discuss overlapping possibilities and errors in those predictions. A proposed fold is additional information to investigate, not an atomic structure recovered directly from the CD curve.[5]
A curve represents a population of shapes
A flexible peptide in liquid can occupy several conformations. Its measured spectrum reflects the combined contributions of the molecules and conformations present during the measurement. An estimated helix fraction summarizes that population; it does not tell the reader which exact residues remain helical in every molecule.[4][6]
This is why secondary structure and a complete structure answer different questions. CD can establish that a sample’s overall conformational character changes, while methods such as NMR can provide information tied to particular residues. Combining complementary measurements can distinguish possibilities that a bulk spectrum leaves open.[4][6]
The distinction is useful when reading about peptide stapling. A CD comparison can support a change in helical character. The curve alone cannot establish the detailed shape of a binding surface, because it reports a broader structural average.[4][6]
Why two curves can differ without a new fold
The magnitude of a reported spectrum depends on how the signal has been normalized, including the sample concentration and the distance light travels through the sample. Errors in those quantities can change the apparent strength of the curve and the structural percentages inferred from it.[6]
Other effects can distort the shape itself. Strong background absorption can leave too little light for a reliable measurement, while particles can scatter light. The usable wavelength range also changes how much structural information is available to the analysis. A smooth graph alone does not resolve these uncertainties.[6]
For a reader assessing a published result, useful context includes the reference set and analysis method, whether the fitted curve resembles the measured one, and whether independent evidence supports the interpretation. A poor fit is a reason to question the estimate. Even a close fit remains a comparison within the method’s assumptions.[4][6]
Structure, identity and purity answer different questions
CD characterizes optical behavior related to conformation. It is not a sequence readout or a stand alone purity test. Greenfield’s discussion treats sample purity and concentration as information that must already be established for reliable structural interpretation, rather than quantities proved by the CD spectrum.[4]
The distinction also explains why a tidy structural result cannot certify the whole sample. Several components can contribute to an optical signal, and a structural average need not reveal every impurity. Peptide content and purity measurements address separate questions about what is in a sample and how the reported numbers were obtained.[4][6]
CD is most informative when the claim matches its scale. It can show that a peptide population has more helical character, reveal a conformational change or help evaluate competing structural descriptions. With the reference set and measurement limits kept in view, a simple curve becomes a useful bridge between a chemical chain and the shapes it adopts in liquid.[4][6]
Sources and further reading
- Greenfield, Using circular dichroism spectra to estimate protein secondary structure, Nature Protocols (2006). DOI: 10.1038/nprot.2006.202
- Micsonai and colleagues, Accurate secondary structure prediction and fold recognition for circular dichroism spectroscopy, PNAS (2015). DOI: 10.1073/pnas.1500851112
- Miles, Janes and Wallace, Tools and methods for circular dichroism spectroscopy of proteins: a tutorial review (2021). DOI: 10.1039/D0CS00558D
Related reading
Buy 1, Get 1 20% Off
Pick any two research compounds. Take 20% off the lower priced one.
Applied automatically at checkout, no code needed
Claim my 20% off →In every pair, the lower priced item is 20% off after other discounts; accessories excluded. For research use only.