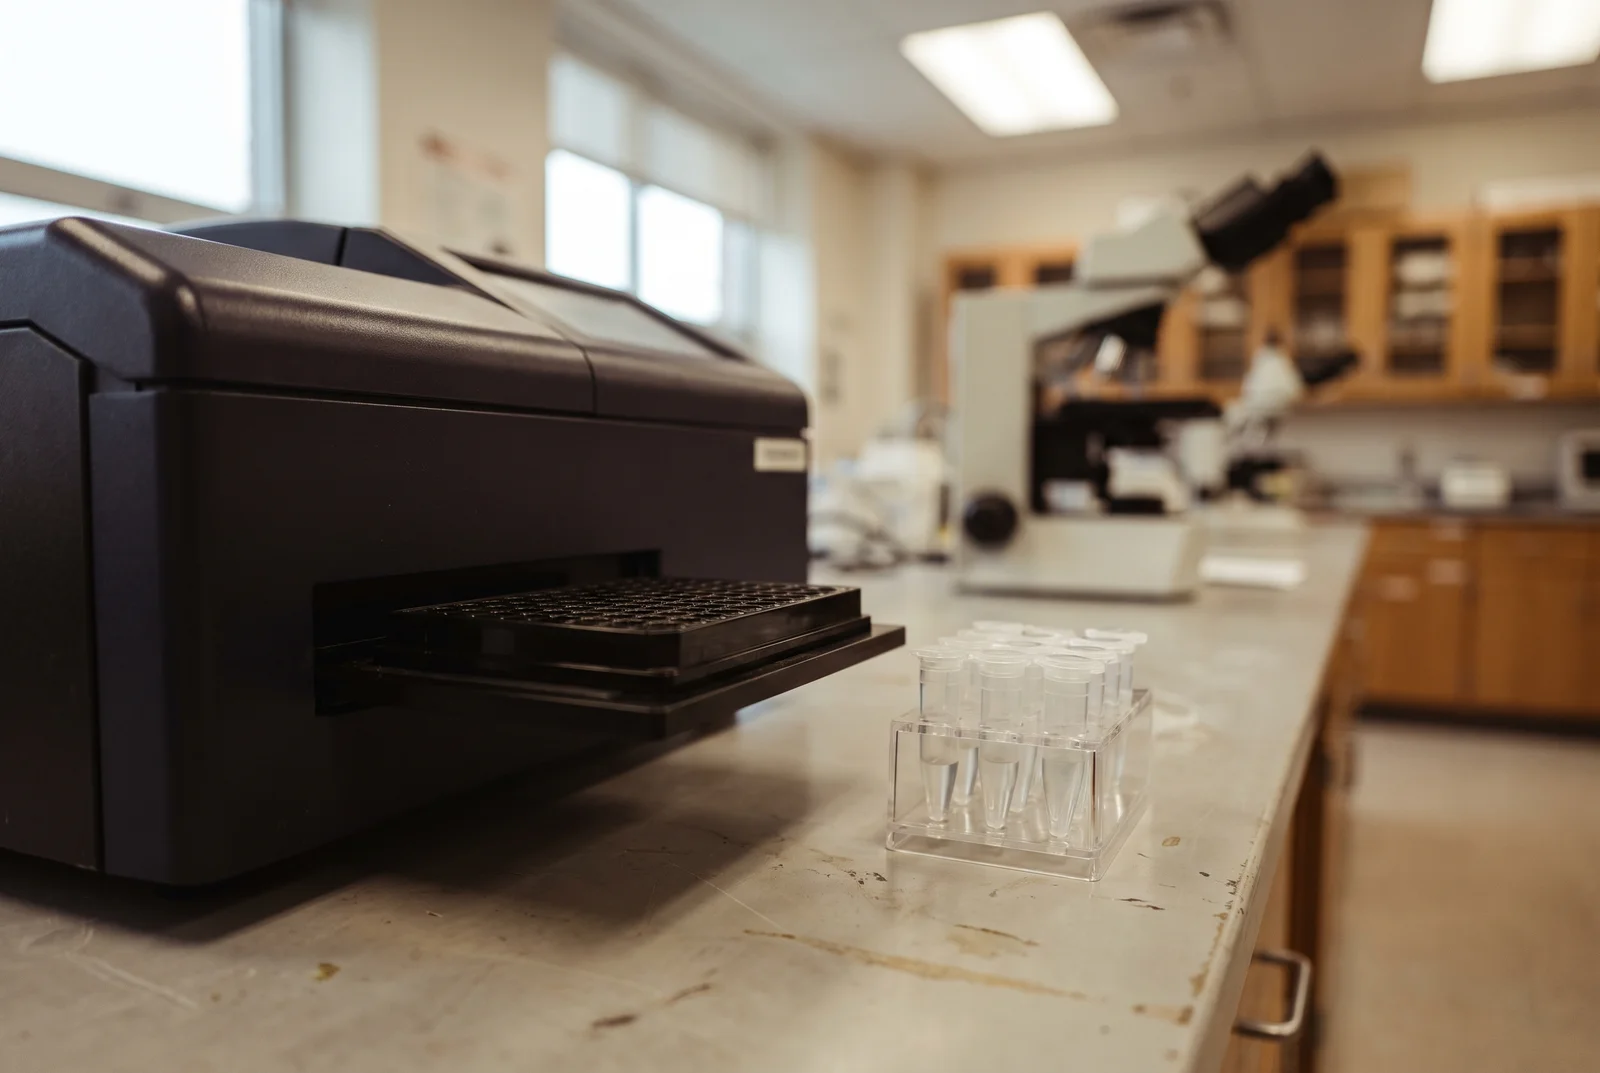
Add more fluorescent dye to the same amount of peptide fibrils and the signal need not keep getting brighter. In a 2017 experiment, it rose and then fell. A peptide aggregation assay records the reporter's response, which can change with the measurement conditions as well as with the peptide assemblies themselves.[6]
Buy 1, Get 1 20% Off
Pick any two research compounds. Take 20% off the lower priced one.
Applied automatically at checkout, no code needed
Claim my 20% off →In every pair, the lower priced item is 20% off after other discounts; accessories excluded. For research use only.
IQON Labs' research use only catalog is separate from the laboratory experiments discussed here. These studies do not evaluate the catalog.
The sample contains different assemblies
The experiments here used peptide solutions in the laboratory, not cells, animals or people. They show how particular assays behave, rather than how every peptide will aggregate.[6][7]
The problem can also begin before the instrument takes its first reading. A later study found that preparations of the same amyloid peptide could enter an assay with different amounts of material already assembled. Getting a useful answer required checking both the starting sample and the signal used to follow it.[7]
Peptide aggregation occurs when peptide molecules associate with one another. An individual molecule is a monomer. Small assemblies are often called oligomers, while amyloid fibrils are elongated assemblies with an ordered internal structure. Larger, less ordered assemblies are described as amorphous aggregates.[8]
Those categories matter because a detector does not necessarily recognize them equally. Thioflavin T, or ThT, becomes strongly fluorescent when bound to suitable amyloid structures. It is widely used to follow fibril formation, but it is not a universal counter for every peptide assembly in a solution.[6][8]
A dim reading therefore leaves more than one possibility. There may be little fibrillar material, or the sample may contain assemblies that the dye does not report well. The dye concentration and background fluorescence also affect the reading.[6][8]
This is a different problem from molecules sticking to a tube wall. Here, the central question is how molecules associate with each other and how the resulting population is represented by the assay. It is also distinct from chemical changes to the molecules themselves: the same peptide sequence can be studied in different assembly states.[7][8]
The first reading can already be late
In a study published online in December 2022, Alexander Taylor and colleagues examined commercial recombinant amyloid beta 42, commonly written Aβ42. The work appeared in the 2023 volume of ACS Chemical Neuroscience. Their immediate problem was reproducibility: samples meant to start predominantly as individual molecules gave inconsistent aggregation curves.[7]
The team compared preparation in 10 millimolar sodium hydroxide with a revised protocol using 50 millimolar sodium hydroxide. The distinction was not simply the concentration written on the solvent bottle. With the weaker solution, the pH measured after dissolving the peptide could fall to between 6.5 and 10.5, far below its initial value of 12.[7]
The researchers attributed the change to residual acids in the vials. A separation method coupled to light scattering revealed variable amounts of large assemblies in those preparations, alongside smaller material. The samples were entering the measurement with different starting populations.[7]
That changed the interpretation of the later curves. The most severely affected samples had a high initial fluorescence and a delayed growth phase. Existing aggregates did not invariably mean faster subsequent fibril formation; some material had assembled into forms outside the main fibril formation pathway.[7]
The revised preparation gave more consistent results. At 4 micromolar Aβ42, the authors reported a proportional standard deviation of 4.9% for the fibrillization half time, the time required to reach the midpoint of the fluorescence rise. Figure 4c shows 88 curves from eight separately prepared samples. Those are repeated measurements across eight preparations, not 88 independent peptide batches or 88 different peptides.[7]
These preparation conditions belong to this experiment. The study is useful because it demonstrates how starting assemblies affect interpretation, not because its chemistry supplies a general recipe for every research peptide. Even the improved preparations showed small amounts of oligomeric material during the separation analysis, although the researchers could not tell whether it had all been present beforehand.[7]
The dye can change the answer
The 2017 study by Christine Xue and colleagues tested a different source of ambiguity: how much of the fluorescence came from the measurement conditions themselves. It examined Aβ40, Aβ42 and a construct containing the prion domain of the yeast protein Ure2.[6]
For the Aβ40 comparison, the researchers combined 11 dye concentrations, from 0.2 to 500 micromolar, with five concentrations of preformed fibrils, from 0.5 to 10 micromolar. They had allowed the fibrils to form for five days at 37°C, then sonicated them before measuring fluorescence.[6]
At the lower fibril concentrations, the uncorrected readings appeared to keep rising as more dye was added. After the researchers accounted for fluorescence from dye alone, the curves instead rose to a peak and fell. Changing the reporter changed the apparent result even though the fibril concentration within each comparison was held constant.[6]
The uncertainty bars in that experiment came from three instrument readings of the same sample. They describe repeatability of the reading, not how much three independently prepared fibril samples would differ. The calculation of fibril concentration also assumed that the starting monomers had all converted to fibrils.[6]
At a fixed dye concentration, fluorescence tracked fibril concentration approximately linearly across the ranges tested. ThT can be useful for quantification within a characterized system. Trouble arises when brightness is treated as directly comparable after the dye or sample conditions change.[6]
The dye was not always a passive observer, either. In experiments following fibril formation, higher ThT concentrations changed the shape of the Aβ42 curves. The same pattern was not seen for Aβ40 or the Ure2 construct.[6]
A changed curve can reflect a different light response or a different assembly process. The distinction becomes especially important when the reporter concentration changes.[6]
Match the measurement to the question
The most useful second test is one that examines something the first test cannot. Taylor's group combined fluorescence with physical separation and electron microscopy rather than treating a smooth curve as a complete description of the sample.[7]
Their separation method, asymmetric flow field flow fractionation, uses liquid flows in a channel to separate particles. Coupled to multiangle light scattering, it helped characterize populations of different sizes, including large assemblies that could be obscured by a conventional chromatography column.[7]
A single ThT reading reports brightness under defined conditions. A series of readings shows the timing and shape of that response. Neither, by itself, establishes the total amount of every type of aggregate or confirms that the starting populations were comparable.[6][7][8]
Separation with light scattering helps distinguish populations by size, but it leaves questions about material that never reaches the detector. Electron microscopy can show recognizable structures in the examined material, while a negative image cannot exclude every small oligomer.[7]
Microscopy provided a useful time comparison in the Taylor study. In samples examined immediately after dilution into the aggregation buffer, the researchers did not see fibrils. After about one hour at 37°C, fibrils were visible. These were observations of 4 micromolar Aβ42 at those times, not proof that every earlier molecule was unassembled.[7]
Physical separation has its own limits. The authors could not establish whether all the small oligomers detected in their improved preparations existed beforehand or whether some formed as the sample encountered different conditions inside the separation channel. A method can reveal a population while also changing it.[7]
An extra purification step has to earn its place
In a 2021 perspective, Peter Faller and Christelle Hureau emphasized rigorous preparation and isolation of monomers by size exclusion chromatography, or SEC. Their discussion included laboratory observations showing that apparently similar amyloid beta experiments could produce different curves.[8]
Taylor's later experiments reached a more conditional conclusion. For the purified Aβ42 material prepared by their revised method, additional SEC made little difference to the relationship between peptide concentration and fibrillization half time. The group still recommended additional purification for samples that needed it, and SEC controls when a new source or possible contamination raised a specific concern.[7]
The difference is useful. The earlier recommendation addresses the risk of starting with an ill defined population. The later study tests whether an added separation step materially changes the behavior of a preparation already examined by other methods. Neither supplies a universal rule that another trip through an instrument proves the sample is free of aggregates.[7][8]
The researchers also disclosed the context of their work. Xue's study reported NIH support and no competing interests. Taylor's study reported University of Sheffield and BBSRC support, acknowledged a detector loan from Postnova Analytics, and declared no competing financial interest. Faller and Hureau reported ERC support and no commercial or financial conflict.[6][7][8]
A useful aggregation result connects the curve to a defined starting sample and a physical description of what formed. As with peptide content and purity, different measurements answer different questions. Without that connection, a brighter signal can be mistaken for more fibrils, and a reproducible curve can be mistaken for a solution containing only individual molecules. The experiments show how to distinguish those interpretations rather than asking one readout to settle all of them.[6][7][8]
Frequently asked questions
Can a clear solution rule out peptide aggregation?
No. Oligomers can remain soluble, so a solution's appearance cannot establish that it contains only individual peptide molecules. The amyloid studies used analytical measurements to distinguish starting populations and later assemblies; visual clarity is not a substitute for those measurements.
Sources and further reading
- Xue et al.: Thioflavin T as an amyloid dye: fibril quantification, optimal concentration and effect on aggregation (2017). DOI: 10.1098/rsos.160696
- Taylor et al.: Simple, Reliable Protocol for High-Yield Solubilization of Seedless Amyloid-β Monomer (2023; online 2022). DOI: 10.1021/acschemneuro.2c00411
- Faller and Hureau: Reproducibility Problems of Amyloid-β Self-Assembly and How to Deal With Them (2021). DOI: 10.3389/fchem.2020.611227
Related reading
Buy 1, Get 1 20% Off
Pick any two research compounds. Take 20% off the lower priced one.
Applied automatically at checkout, no code needed
Claim my 20% off →In every pair, the lower priced item is 20% off after other discounts; accessories excluded. For research use only.